


73
/ 100
SEO score
Surely one of the first things you will ask yourself in your digital business is: how can I improve my conversion rate?
We can do it in several ways:
Increase traffic
The more people visit your website, the greater the chance that they convert.
There are several ways to make this possible, but the most important point is that it takes time, effort, money, etc., depending on whether we increase that traffic organically or through online advertising on channels such as:
You may be interested in: Remarketing. Create campaigns in Google Ads and Facebook Ads
Improve our conversion
This is the point we will look at in this article, that is, optimizing our traffic to convert a larger number of people.
What is CRO and how can we improve our conversion rate?
CRO (Conversion Rate Optimization) significa conversion rate optimization. It is important to improve the results of your online business.
Just as SEO and PPC are about attracting more traffic to a website, CRO aims to continuously improve a website or digital business to increase the percentage of sales, leads or any type of conversion.
In short, it is characterized by achieving an optimal conversion rate.
We could say it is an optimization process in which we collect data, analyze it and detect the points we can improve without needing to attract more traffic to increase conversion.
How do we work on this conversion optimization process?
To work on CRO, it is important to have a goal and a strategy to optimize conversion and, above all, to be very aligned with the business. That is why we need a process of research and analysis of improvement points, to detect which aspects have the greatest impact on the business and which changes could help us get a more beneficial result.
This way we will know where to invest time and money in optimizing the website to increase revenue.
CRO phases
CRO is a cyclical process in constant improvement. Next we will look at the most common phases:
1. Overview
Before starting to make changes, implement tools, etc., we must understand the website as a whole. We must recognize its characteristics, benefits and potential problems.
An example:
- Does it sell physical products or services?
- Is it a corporate website whose goal is to attract customers?
- What is its design like? Is it clear, attractive, well structured? Does it convey what it wants to communicate?
With all the data extracted in this phase, we will complement it with more data that helps us get an even broader view, to have a reasoned, analytical and unemotional opinion on how the problems should be fixed
2. Specific data
In this Phase 2 we will extract the problems that may be affecting conversion, and for that we need quantifiable data, so we will use web metrics.
With all this we get, on one side, quantitative analytics (what is happening) and, on the other, qualitative analytics (why it is happening).
Quantitative data
This is all the data that can be expressed in numbers and percentages and that gives us an objective view of the behavior of our visitors on our website.
An example is the following image generated in Hotjar of a conversion funnel with a conversion ratio of 10.6%, although this funnel could also be generated perfectly well with Google Analytics.
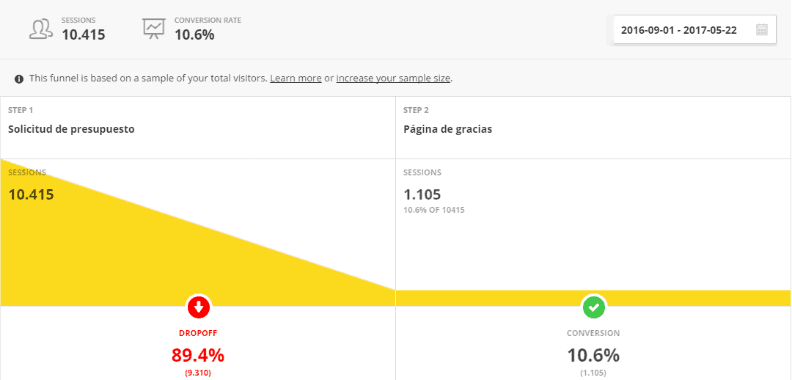
If we analyze this conversion funnel, we will see that many visits reach the quote request form page and drop off, so they don’t complete the goal or conversion, that is, the form. It is evidence that changes are needed to improve it.
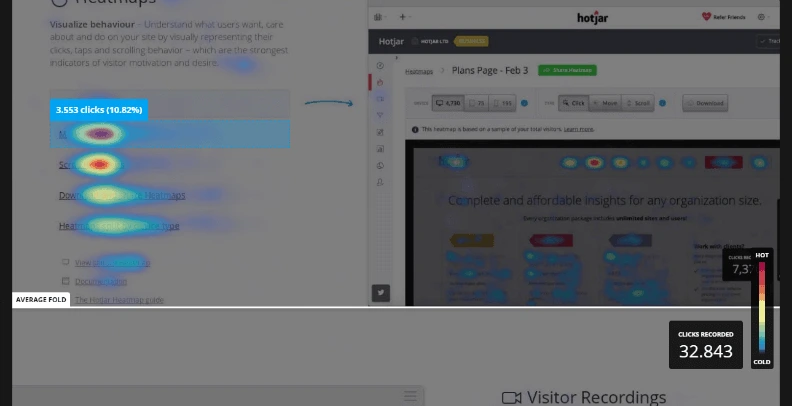
Another example is the heatmap that shows us the number of clicks users make on the elements of a given page of our website.
This is very useful to see the real behavior of users. Often you can find user behaviors that may surprise you, such as images that attract more than usual, colors…
A common problem can be, for example, that images are not linked, so users cannot see more information about them because the image has no link and the click takes them nowhere.
Analyzing qualitative data
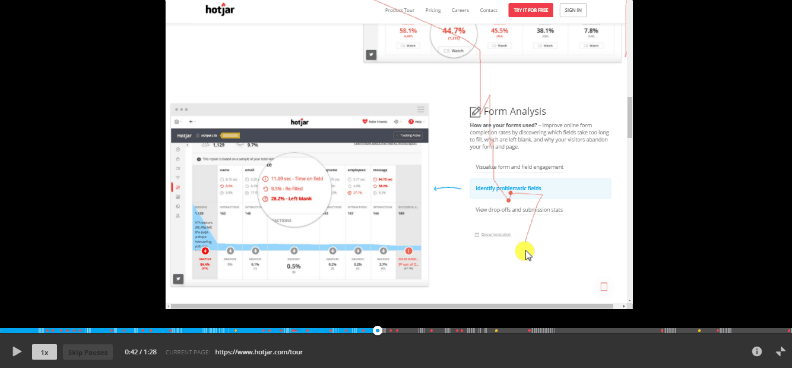
The data is collected through methods that let us know the behavior of visitors from a more subjective point of view. This helps us recognize behavior patterns and determine why they do what they do.
An example of qualitative data is recording sessions with Hotjar o Smartlook.
From an analysis of all this data we get a list of the points that need improvement. It will also help us understand why those points are not working properly and how they can be improved. With all this, A/B tests are run to determine what works best, and then it is implemented for good.
You may be interested in: The best content optimization methods in SEO
3. Hypothesis formulation
With the previous phase we have finished all the research to get the data. At this point we will start to set up the tests, so we know how to improve conversion in a real way.
In CRO, hypotheses are assumptions based on user behavior data, which show that users are not doing what we want.
The ultimate goal of hypotheses is to test everything we think could mean an improvement in conversion and solve problems with possible solutions. It is important that all hypotheses can be quantified and validated.
The test, on the other hand, is what lets us verify statistically whether the hypothesis holds or not. There can be several tests for the same hypothesis.
A simple way to formulate hypotheses is with this hypothesis template:
Changing [el elemento que queremos cambiar] for [the change we want to implement] will increase the conversion rate for [our conversion goal].
4. Hypothesis validation tests
Once the CRO phases of overall view of the website, goals, user behavior and hypothesis formulation are completed, we will create the tests needed to fix what we want.
The most common way to run tests is with A/B tests and multivariate tests. It is important to know that every element we decide to change to improve conversion is a variable, such as a form field, a headline, a change of button position, a change of color…
Two ways of testing are:
- A/B tests, where we can only change one element. Example: the A/B/C/D variations, in which the element to change will be different in each one.
- Multivariate tests, where the number of variables to change can be multiple.
To run a test and see the conversion rate, we must have a control version. This is just the original version of an element to test, with no change or variation.
You have to define the duration of the tests. This is important because the duration of the test will always depend on the traffic volume.
A good tool for running these tests is Google Optimize. It is easy to use and configure and integrates very well with Google Analytics.
Finally, when the tests have ended, we will have to analyze the data obtained. This point is key, since the decision made must be based on data for the final implementation.
5. Making changes
With all the hypothesis validation and tests, it is time to implement the improvements for real and then keep analyzing to see possible improvements to implement, completing your own CRO.
You may be interested in: Business case: create it successfully in 6 steps